

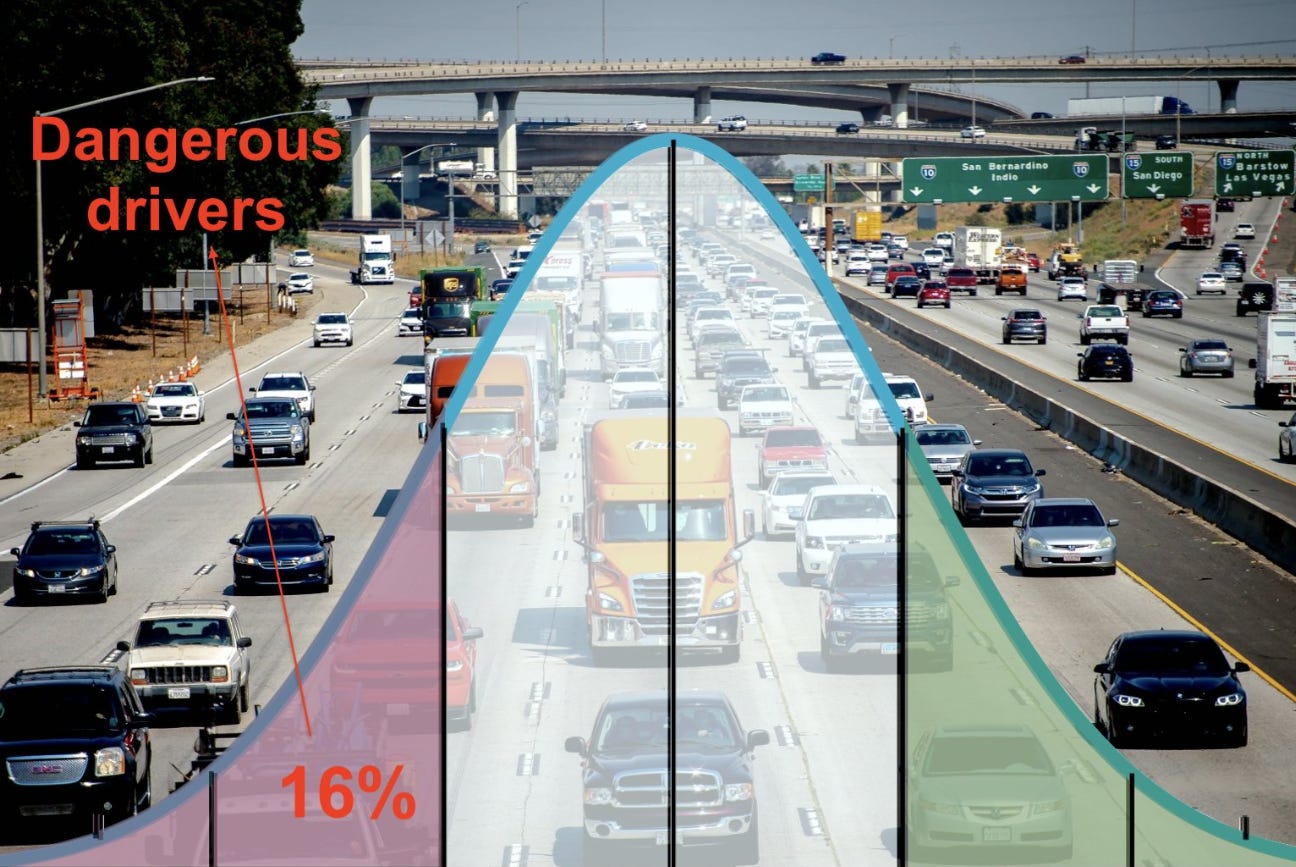
The 16% of Dangerous Drivers Dilemma
This small subset of drivers makes our streets even more dangerous.

American roads have become increasingly unsafe in recent years. There is disagreement about both the causes and solutions to this ongoing problem. I am not going to pretend to solve this issue, but I do offer one explanation: the 16% of Dangerous Drivers Dilemma.
These in the 16% are the drivers who you see darting in and out of traffic, weaving at dangerous speeds on the highway. They are also the drivers who are constantly fiddling with and checking their phones. Every stoplight is a chance for them to get a hit on their addiction—perhaps not as dangerous, but certainly annoying delays.
This 16% concept encompasses drivers who are old, young, addicted, angry, and generally incompetent. In this article, I walk through the numbers and consider ways to grapple with this dilemma.
Normal Distribution of Human Capabilities
This 16% number I landed on has been derived from the concept of the normal distribution. Plot any type of skill or trait and you will find a bunched-up portion of humans in the middle, with a spread of variation emanating out from the average, on both extremes. This is the normal distribution.
The normal distribution is the spread of scores or measures within a population. There will naturally be a majority of scores in the middle at the average, spreading out with fewer responses the further towards the extremes. Of course, there can be subset population variations.
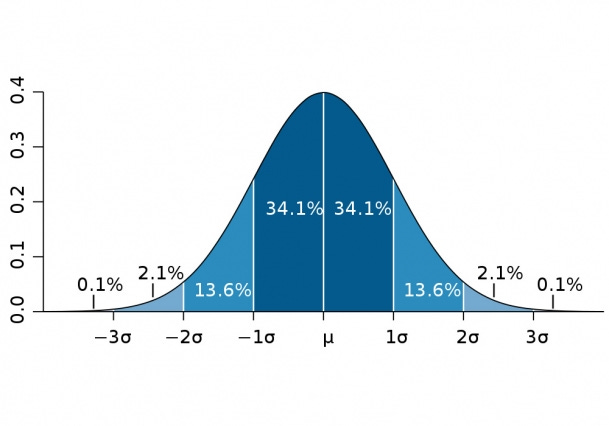
With the normal distribution, half of the observations will be below the mean and the other half above the mean. One standard deviation from the mean in either direction is 34.13% of the observations. Within two standard deviations is 13.59%. From three, it’s just 2.14%, fourth is .13%, and anything beyond these extremes is miniscule. I get 16% from the percentages beyond one standard deviation: 13.6%+2.1%+0.1% = 15.8%. I round this up to 16% just for ease of the moniker.
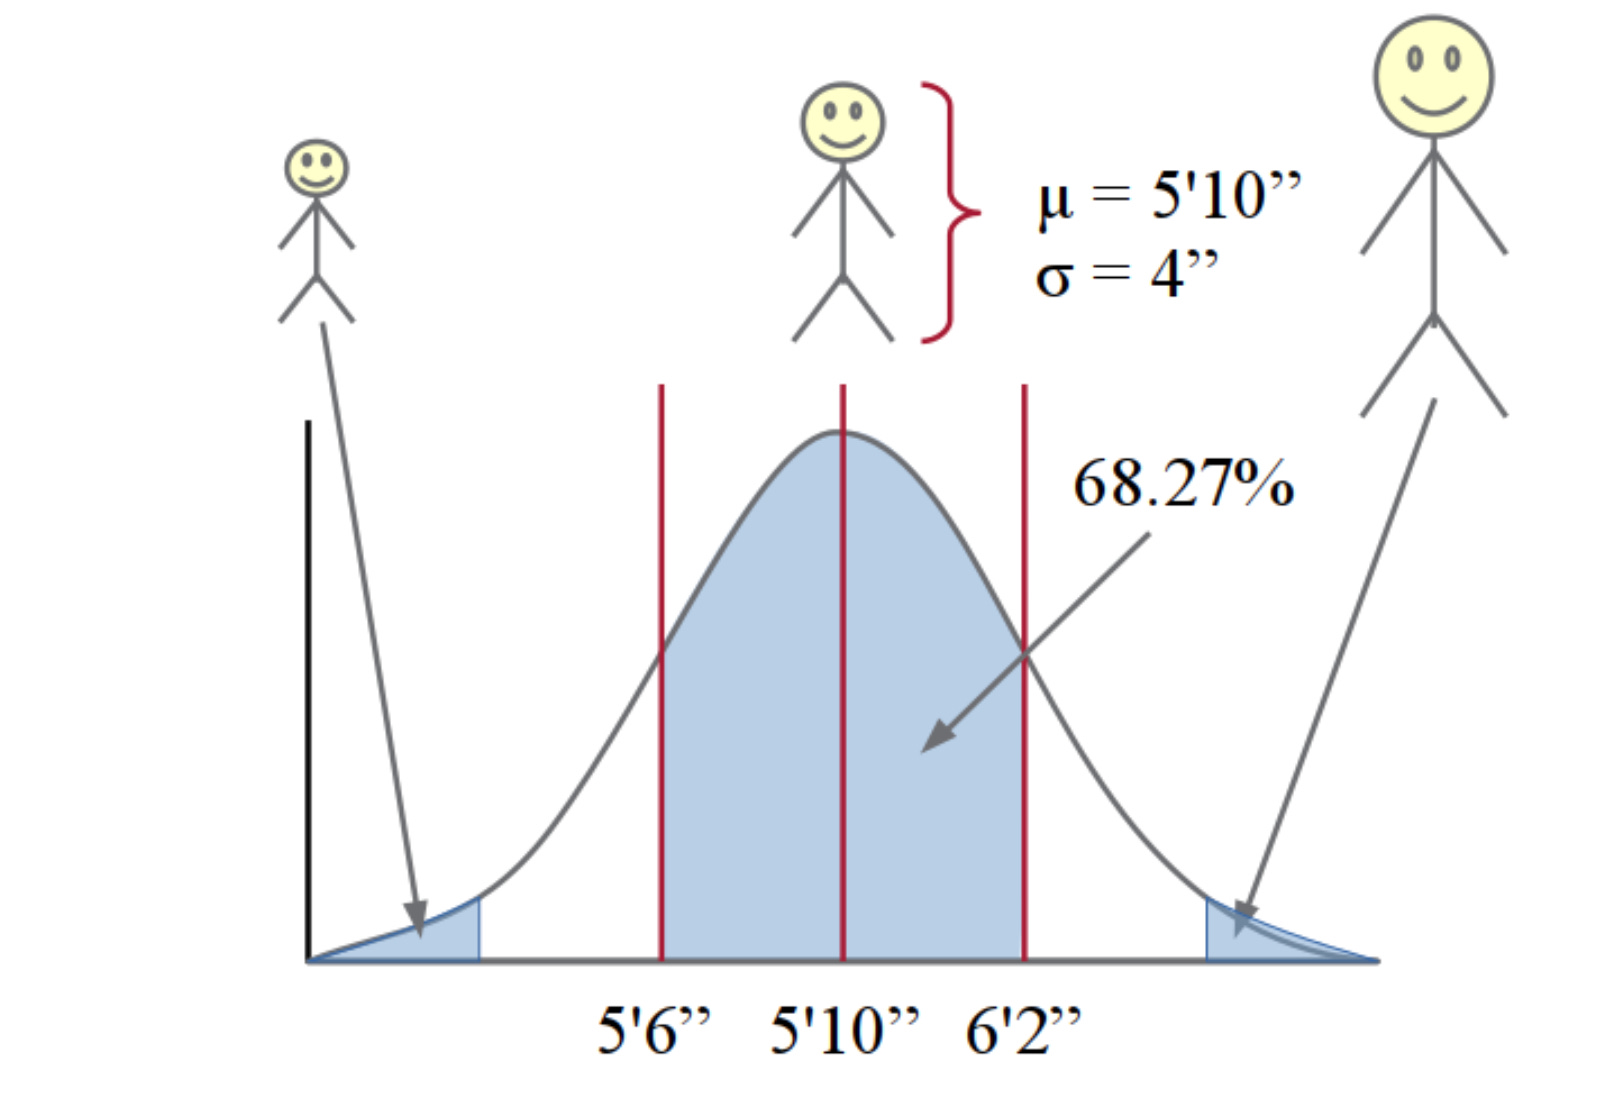
The normal distribution pops up throughout everyday life. The most well-known application of the normal distribution likely comes from IQ or other forms of testing, which I recognize is controversial (where most people relate these principles to a Bell Curve). Nonetheless, these tests are meant to be normally distributed. But even throwing this one out, there are other examples to illustrate normality of human capabilities.
The normal distribution works for basic demographic traits such as height or weight. But also works for skills, such as basketball or other sports. Only about 3.4% of high school basketball players make it to play in college at the NCAA level, all according to data from the NCAA. Of those who made it to college, only about 1.2% make it to a top pro league like the NBA. College basketball players are in the 95th percentile, while NBA players are in the 99th percentile on the normal distribution of basketball skills.
These same breakdowns work with driving. Drivers for NASCAR are the same extreme end of the distribution for driving as their NBA counterparts in basketball. Like any skill, most people will sit near the average of the driving distribution. Yet, there will inevitably be a group at the end extreme end, opposite of NASCAR, that make up the 16% of dangerous drivers.
The driving test gives us one proxy for this concept. Data shows that 78.8% of American drivers pass the skills version of the test (the driving portion), only a few shades less than the 16% mark in terms of failure rates. Chalk some of that up to test nerves. Some may take multiple times to pass, too.
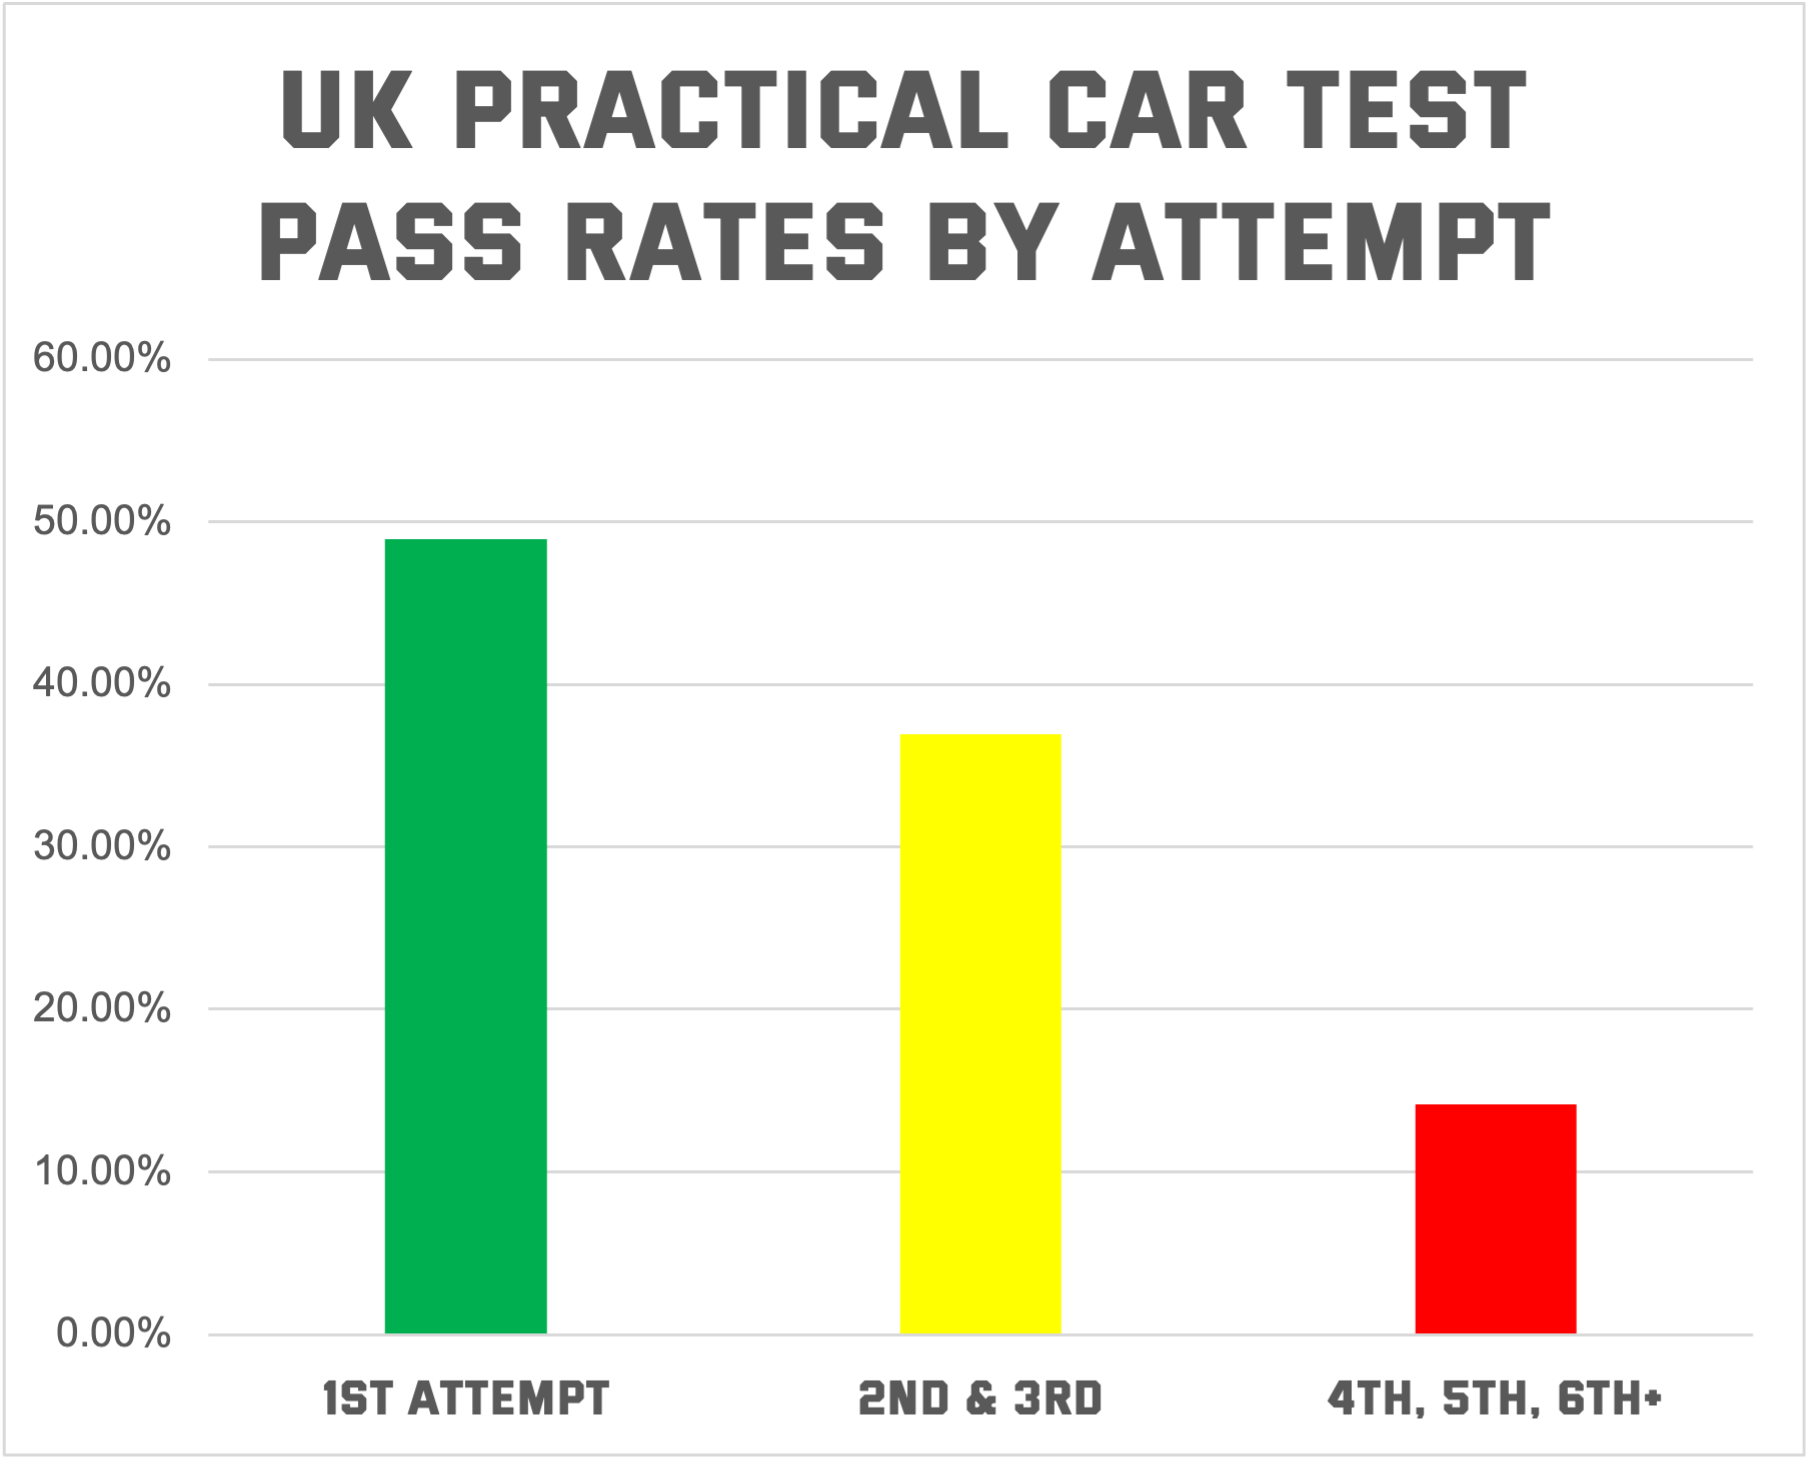
While we do not have great data on driving tests from the US, the UK provides national passing rates. In the UK, roughly 49% of drivers pass the practical driving test on the first try, aligning perfectly with the normal distribution. Drivers who pass the test in the second or third time account for almost 37%, which again aligns closely with the normal distribution between the mean and 1 standard deviation. Finally, a little over 14% needed four, five, six, or more attempts to pass. In fact, some drivers need 30 or 40 attempts to pass. Those in the extreme end are all the 16%.
85% Rule
Another support for my 16% conception comes from the field of traffic engineering. When deciding what speed limit a street should have, traffic engineers do a study to see how fast drivers typically drive in the area. The engineers then average out all of the scores and set the limit at the 85th percentile of all driving speeds.
This means that speed limits in the US are explicitly tied to drivers at around basically one standard deviation from the norm. The practice tracks with the 16% conception. Traffic engineers quite literally believe in this range of human capabilities to successfully navigate roadways.
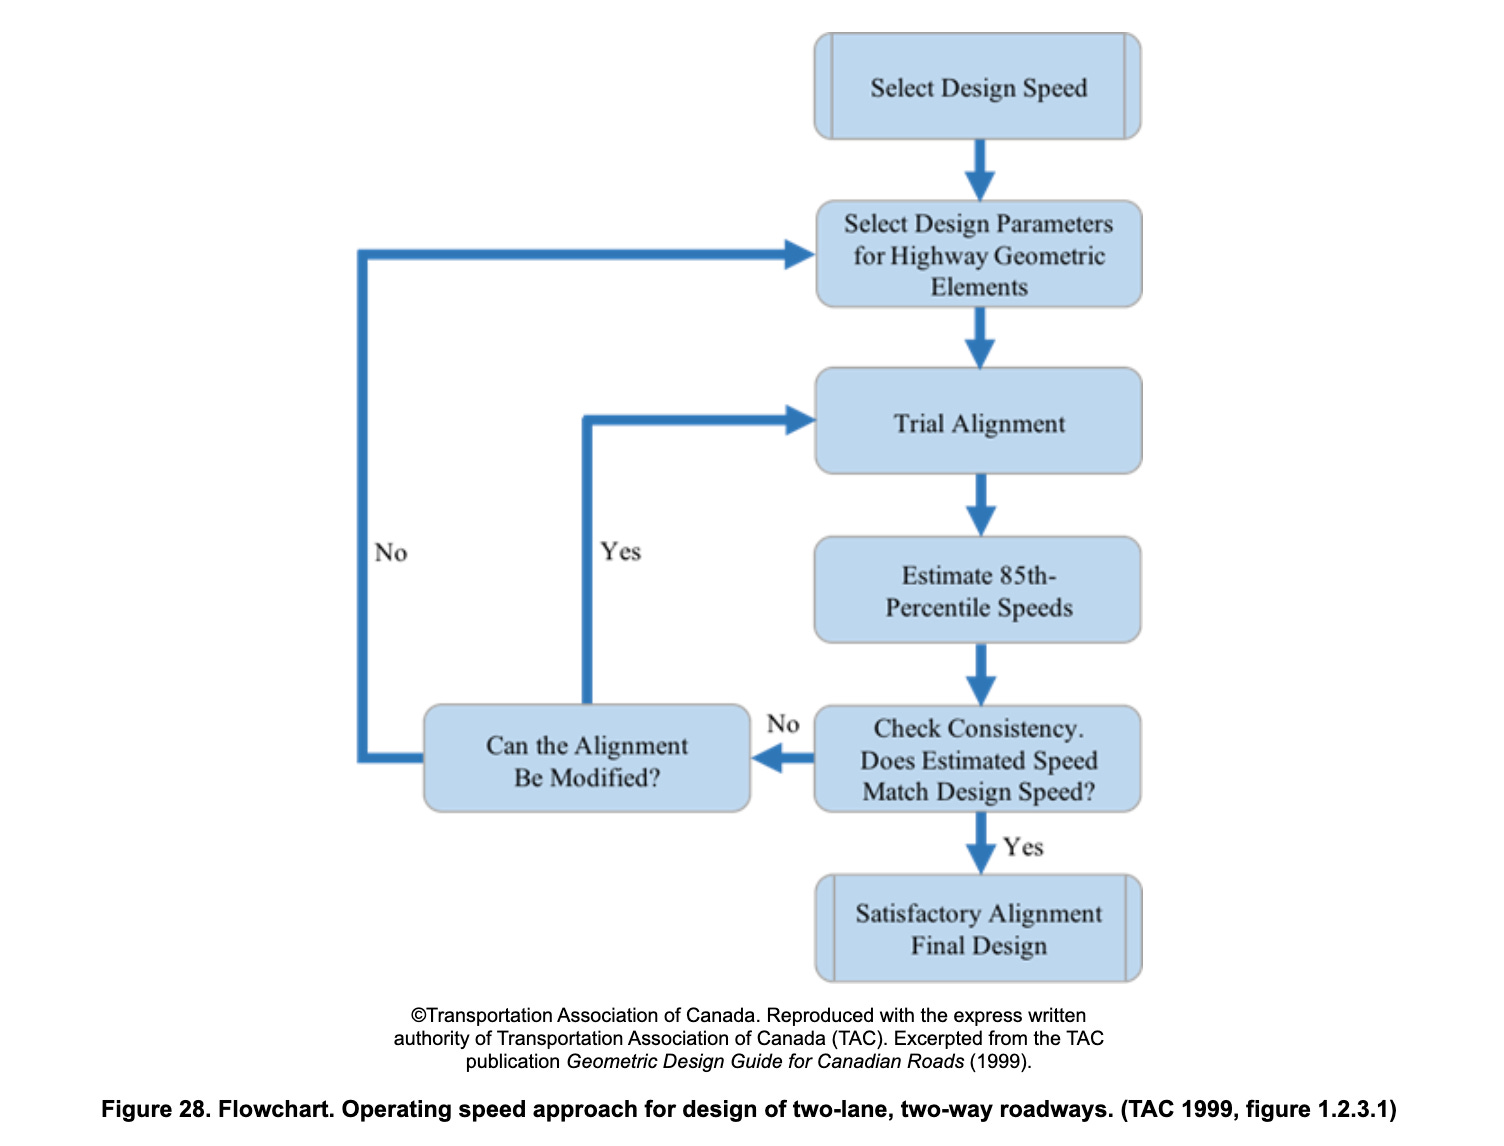
In recent years, the profession of traffic engineering has been heavily criticized for too much adherence to car-centric environments. Strong Towns, in particular, has taken aim at these tactics. The organization’s founder, Charles Marohn, says that the 85th percentile rule can be useful for high-speed streets, but it is not a one-size-fits-all solution:
A road is different than a street, which is a platform for building wealth within a community. On streets, where there is vastly more complexity, the 85th percentile speed is almost always misapplied. Especially where a forgiving design approach is used for street design, drivers will not perceive the complexity of the environment. When engineers widen lanes, create recovery areas, make curves more gentle, and use other design features developed for highways, they give the driver the incorrect signal that the environment is simple, that they can relax and not be hyper-vigilant. Speeds go up and tragedy is the inevitable result.
Despite the critique, it shows that there is a logic to the 85th percent rule; it is just taken to the extreme in most of our built environments. This is not a test of driving ability, as I am suggesting with the 16% concept, but rather just of speed. It does, though, give us a practical proxy that is used in the real world. I’m sure traffic engineers would love to have some real driving test for their speed studies.
Follow the Insurance Money
Insurance companies know all about the 16% already. They price in the fact that not every driver is the same as the other. It is industry standard to charge different rates for various driver types. Very young drivers get charged the most, then the rest of us pay some kind of standard, and there are a range of ways to reduce that with good driving record.
Insurance companies do this kind of pricing because they are not in the business of losing money. On the contrary, they are quite profitable, and part of that business success is recognizing the 16% of bad drivers. In general, they track with age as a proxy, with young drivers paying the most by far. There is a curvilinear relationship to age, though, as it goes up, insurance rates go down. This is true until about 60, then rates start ticking back up.
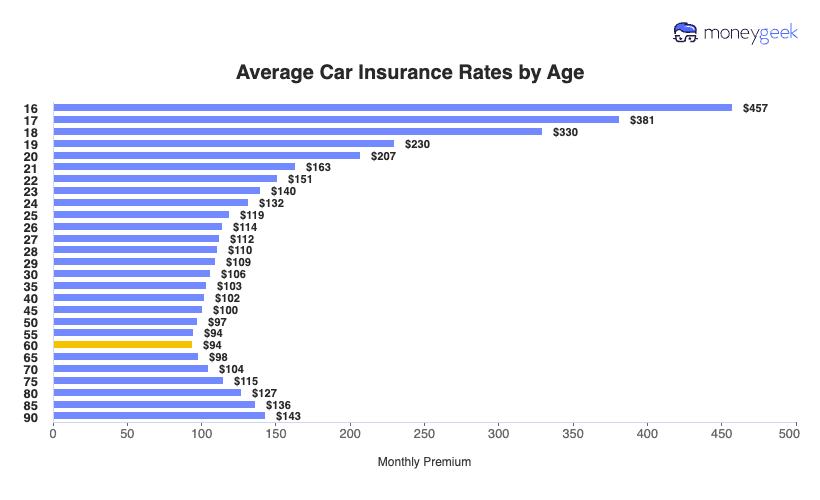
It is a crude measure of the normal distribution, yet still illustrates the concept tied to real-world money. Follow the money! There is a reason why young men in particular pay the most: they are more aggressive, irresponsible, and stupid behind the wheel. The insurance industry accounts for this disparity in driving skill.
According to Matt Timmons, author of State of Auto Insurance in 2025, insurers will offer sharp discounts to perceived good drivers. “This includes a 10-15% discount for drivers who take a defensive driving course, a 10% discount for safe drivers who’ve been accident-free for over 5 years and a 20% discount for drivers with low mileage use,” he said.
The insurance industry is very lucrative. They are not into losing money. Even they can see the 16% Dangerous Drivers Dilemma.
Drivers, Young and Old
The 16% label is not a Scarlet Letter. Instead, we age in and out of being in the 16%. Most very young drivers are terrible drivers by dint of experience. There is simply a learning curve for learning to drive. But there is also an immaturity factor. Teenagers think they can live forever and nothing can hurt them, with tragic consequences.
Confession time: I was in the 16% when I was a teenage driver. So were most of my friends. We were all idiots. And my own high school experiences saw multiple vehicular deaths that still weigh on me to this day. After a few years, young drivers age more into the middle part of the distribution to safer and reasonable driving.
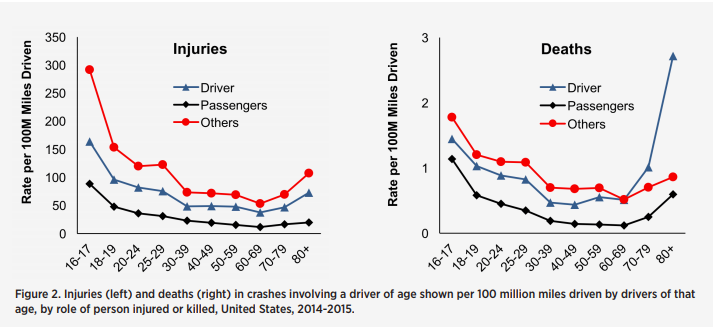
Luckily, young drivers usually age out of this irresponsible stage, which is what happened to me. However, on the other end, drivers can age back into the 16%. As we get older, we lose our faculties. Our eyesight gets worse, our reaction time slows, and our mobility diminishes. Driving skills regress. Data from AAA show that young drivers are the most dangerous, but senior drivers are more unsafe than middle ages.
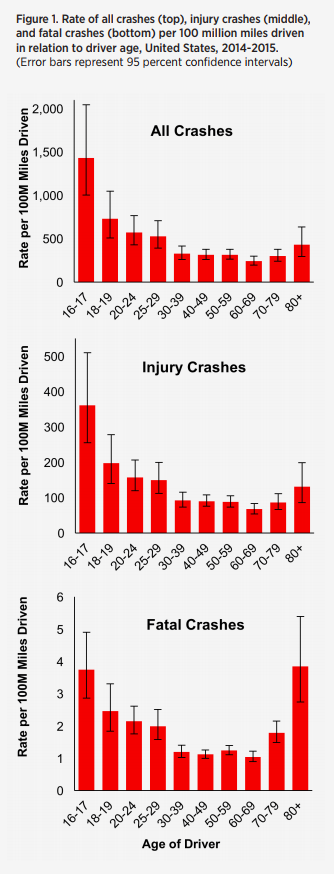
This degradation of physical abilities is why a lot of senior drivers drive very slowly. Driving slowly is certainly safer than the maniac teenage driver, but mixing slow with fast speeds into traffic causes its own problems. Again, it goes back to the 85th rule. Likewise, even at slower speeds, vehicles can be deadly if the driver loses control of the 5,000 pound SUV.
But there are even more issues with seniors losing their ability to drive, yet continuing to drive out of necessity. There has been a slew of tragic deaths recently due to senior drivers losing control of their vehicles and plowing into innocent bystanders. This is becoming a growing issue as the Boomers enter these age ranges.
Super Speeders
Many cities have noticed that there is a small group of people who have an enormous amount of traffic violations. In fact, much of crime operates in the same way. Remove a small number of extreme end criminals, and a greater total percentage of crime will decrease, argued in the aptly titled paper “1% of the population accountable for 63% of all violent crime convictions.”
These are called “super speeders.” They make up a good portion of the 16%, and likely the least sympathetic. Often, this is not about physical ability, like rookie drivers or aging seniors, but just a total disregard for anyone else outside of their own car. States have been grappling with these super speeders across the country.
For instance, in New York, those labeled as “super speeders” average roughly 179 speeding-in-a-school-zone tickets, which equals a traffic violation every other day of the year. Georgia and Maryland recently passed "Stop Super Speeders" bills. Virginia and D.C. did something similar, too. The extreme end of the normal distribution for driving causes so much traffic violence and damage that states must make special efforts to grapple with this subset.
These laws usually target installing Intelligent Speed Assistance (ISA) or “governors” that throttle a car’s speed. Yet, advocates argue that the penalty of a short license suspension is not enough of a deterrent. '
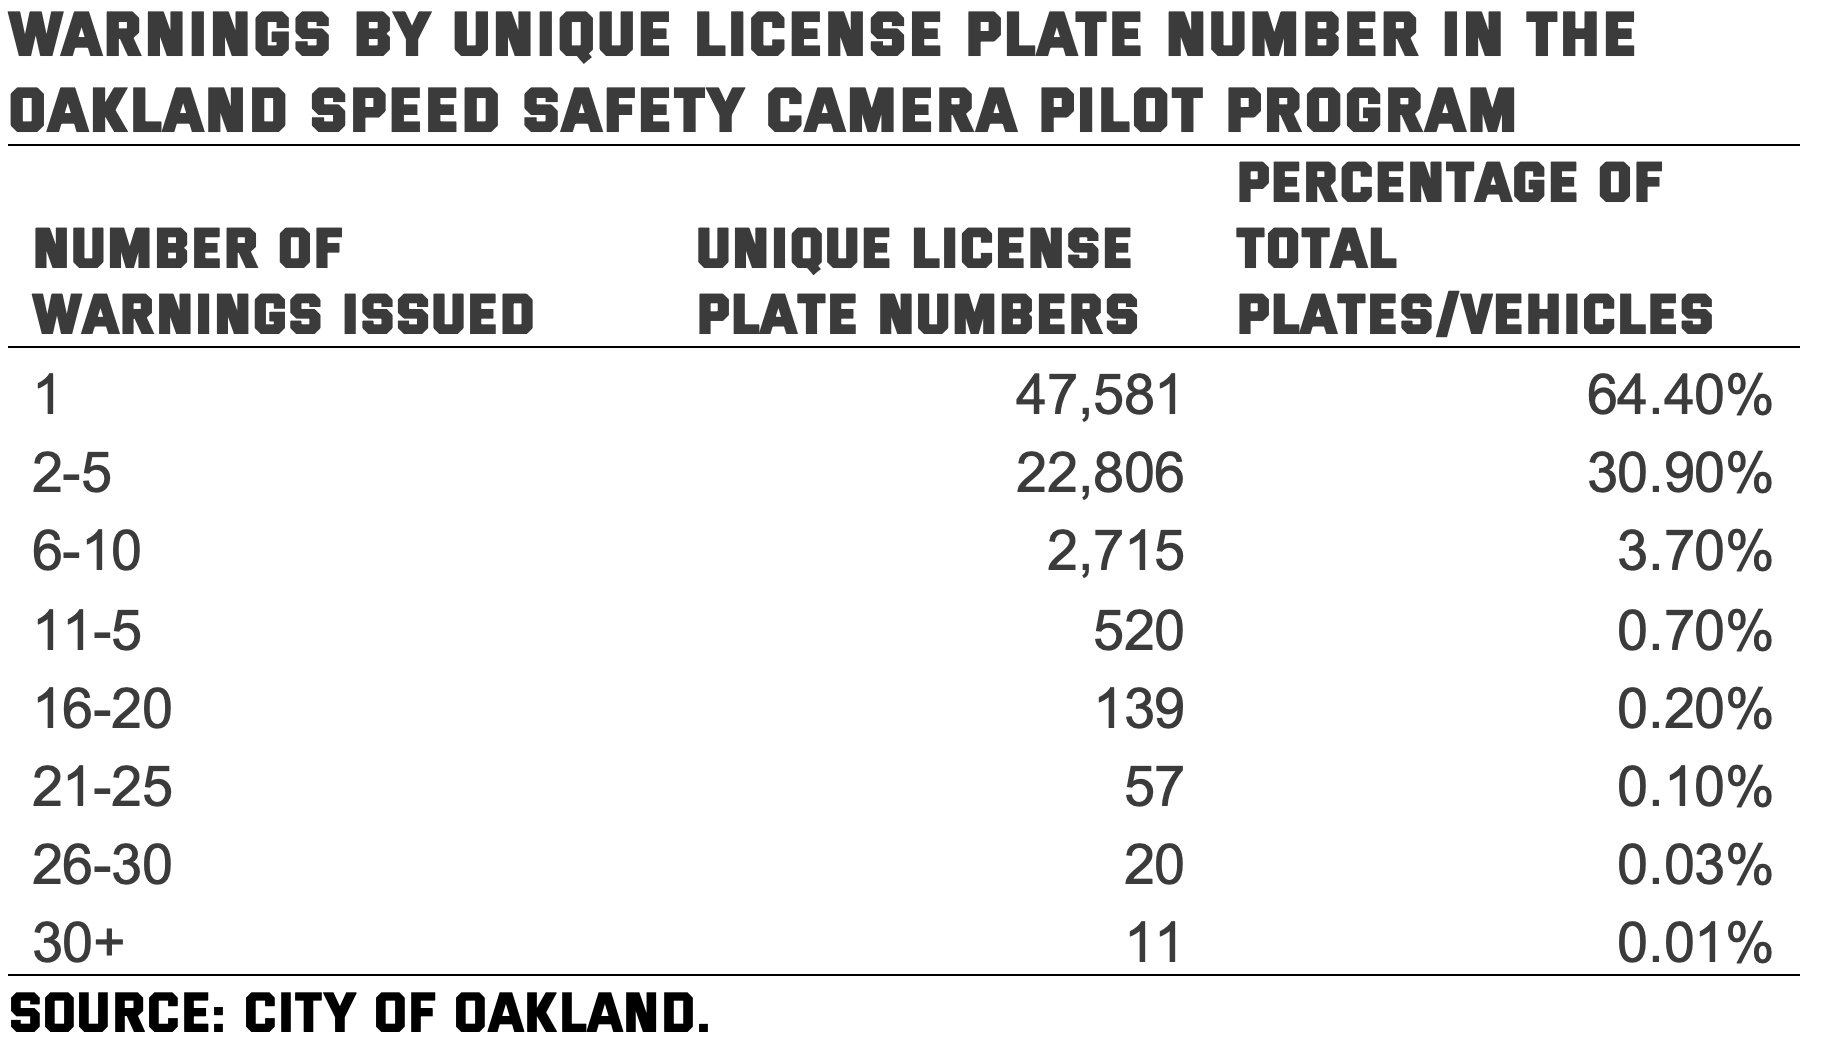
Automatic ticketing cameras are another tactic against super speeders. A pilot program in Oakland installed 35 speed cameras at 18 locations. The results showed that 64.4% of drivers who received a warning did not get another ticket. But 30% of drivers received two to five tickets, 3.7% six to 10, and 11 or more at around 1%.
These types of cameras do work to a degree. “San Francisco’s speed cameras slashed excessive speeding from 25% of traffic to just 2% to 6% within a year,” according to the LA Times. But in New York City, the automatic ticketing has a lower fine than if written by a cop, hindering some of the sting to super speeders.
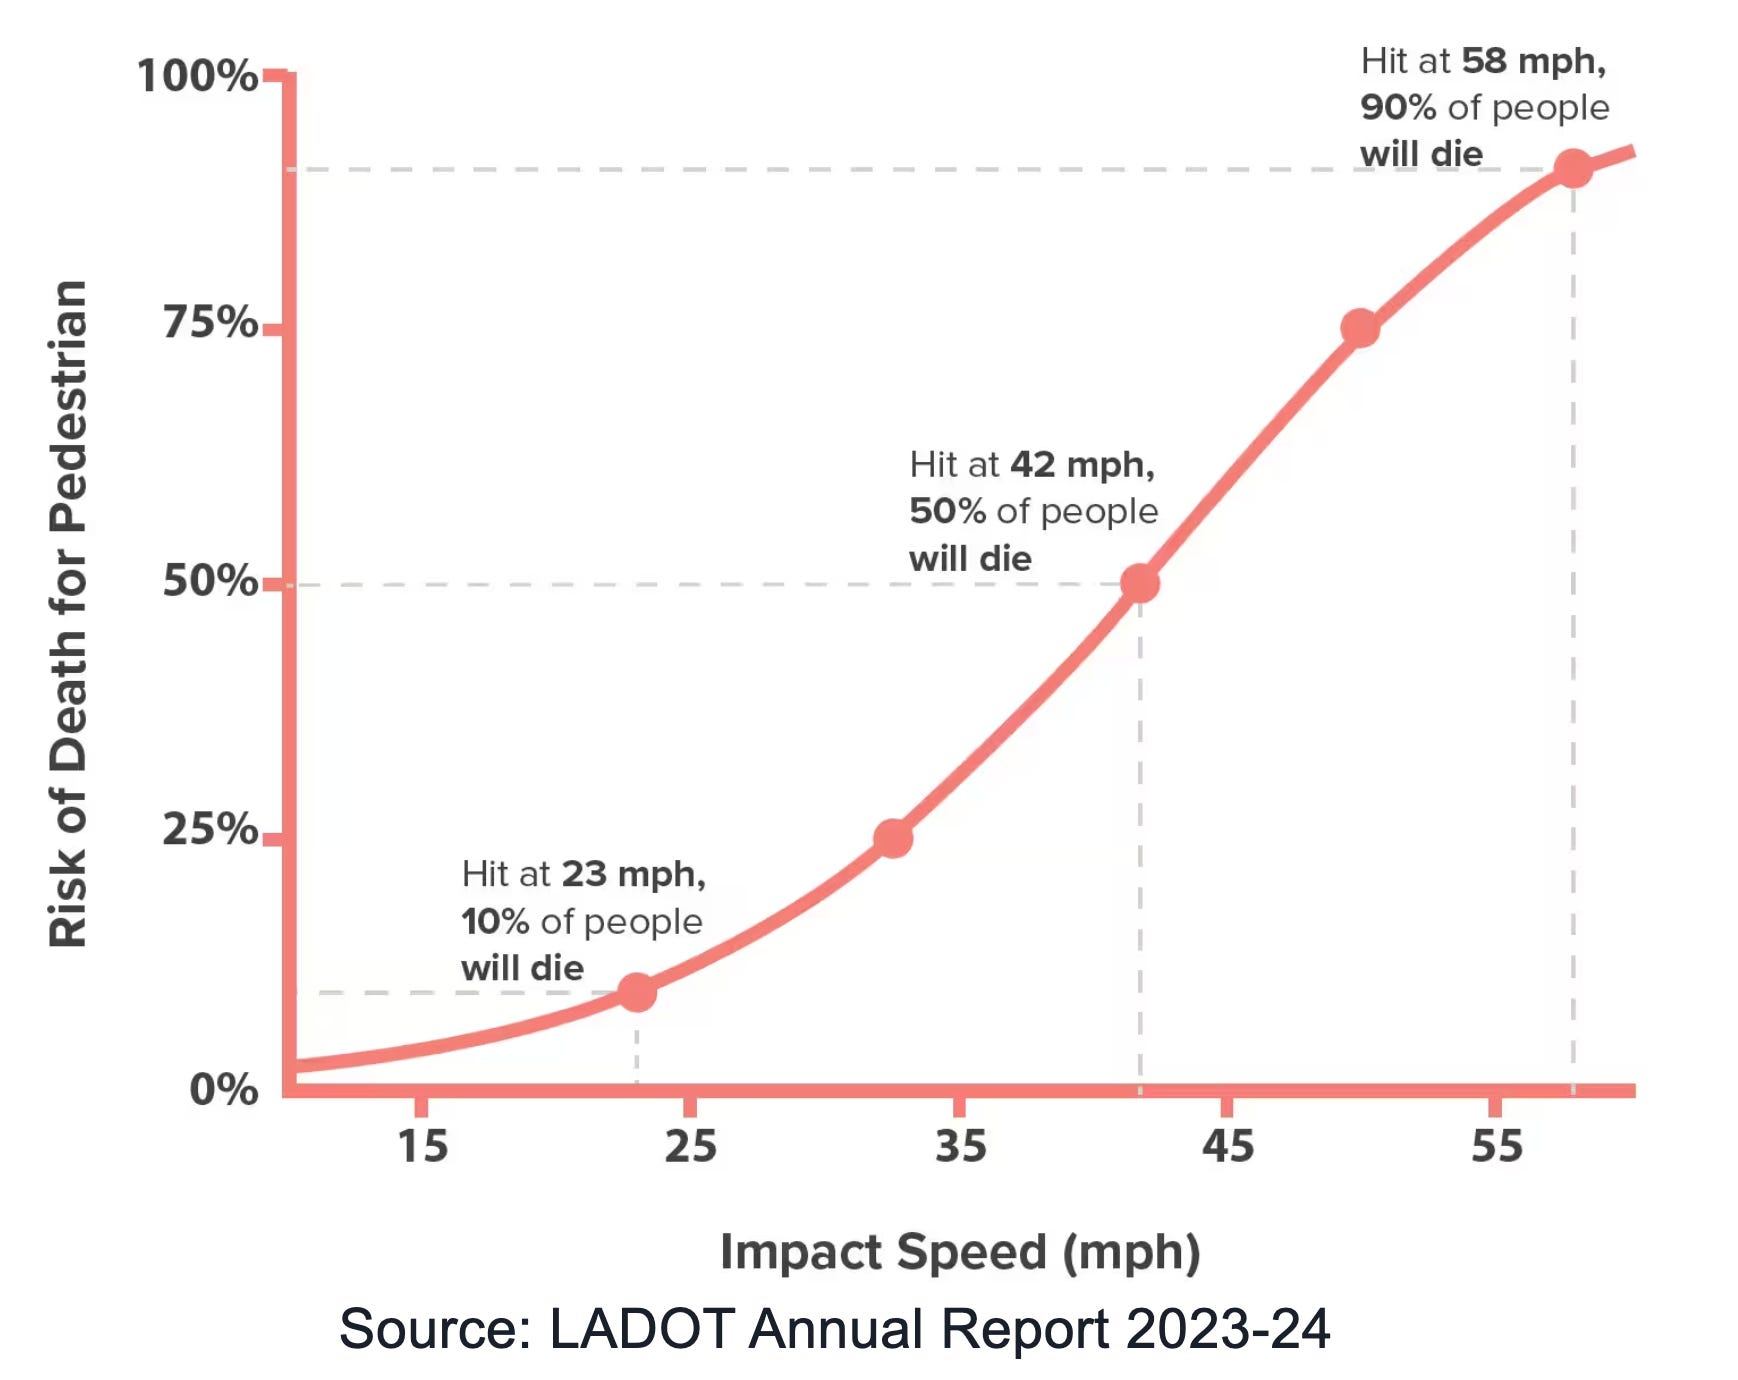
Not dealing with these super speeders has serious consequences. Speed is the biggest factor in fatal vehicle crashes. According to a study in the Journal of Safety Research by Walton and Hendy (2024):
Ticket accumulation need not be considered the best predictor of crash likelihood, but around 1 in every 8 persons (12. 66%) who accumulate more than four tickets within an observed two-year period are later involved in a CAS-recorded crash, where they are the driver at fault. This represents a large concentration of risk compared to the overall base estimate of 1.22% incidence over three years. This risk is clearly identifiable in a particular portion of the driving population because records are kept for every ticket.
While speed is the most important factor, these 16% go beyond just one measure. There is a general flippant demeanor to dangerously driving a 5,000-pound vehicle. In Maryland, one driver had over 900 unpaid parking tickets.
We could lop off some serious dangers if we just took these people off the road. Our laws are usually are forgiving to license suspension, even when they have some kind of horrible incident. And I don’t use accident here. Whenever someone like this kills or maims another person, it is not accidental; it follows a pattern of risky behaviors.
The 16% Dilemma is Getting Worse
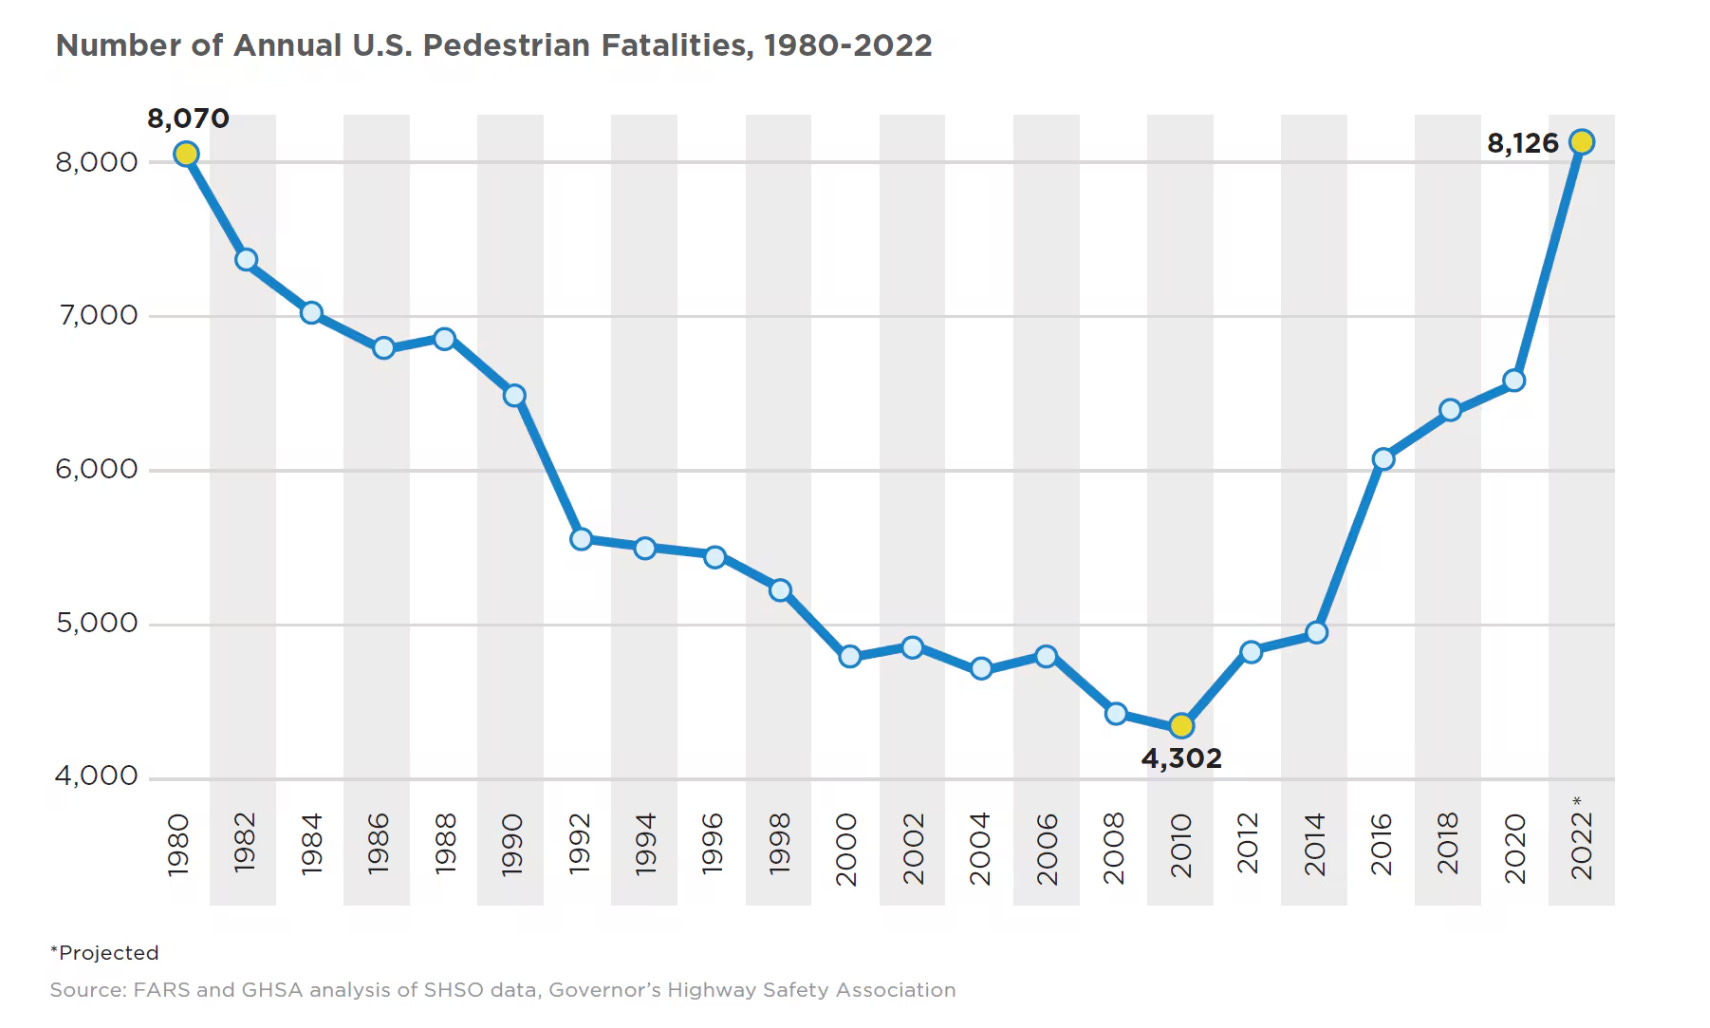
There are some aspects of the 16% dilemma that have been exacerbated in contemporary America. Our stroads do not help anyone, whether in the 16% or not. One of the key problems is the phones (I know, the root of so many modern ills).
I didn’t drive for almost 10 years, from roughly 2009 to 2019. This is the exact time period of the proliferation of the smartphone. The differences in driving then to now are stark. Everyone is on their phone. I am dumbfounded by just how often I see a fellow driver looking down at their phone. Given how dangerous it is, there should be more shame in it.
But people do not care, they simply look down at their lap, then snap back up like awoken from a delirium. In a traffic line, these phone drivers cause delays by limiting how many people can make it through a light. When they do snap up, they try to jam on the gas to catch back. This just creates more unsafe situations, all for a screen addiction that we have normalized.
On the extreme end, there are a lot of 16%ers who are simply driving around on their phones. It is stunningly dangerous. Yet, you will see multiple people doing on any commute. Next time you are driving, try to count how many you see on their phones. It should be about 1/16 drivers or so with their head looking down.
Another problem is that American cars have ballooned to ridiculous sizes. Bigger cars are simply more dangerous to everyone not inside of them. There are just realities of driving that relate to physical space. A person of smaller stature will have a more limited view in certain larger types of vehicles. They will be a danger to other people on the road because they have lower vision. There is no way to get around that other than simply driving a smaller car.
Height limits on certain types of cars would make sense. But there would be some kind of civil rights appeal. This is a very American problem, perceived personal freedom is a higher value than consideration to broader community, even if the behavior is risky or detrimental. See one example from Florida recently:
The Delirium of Dangerous Driver
As a society, Americans have been resistant to removing the 16% from out roads. Our overinflated, auto-centric design has limited our choices to everyone having to drive. Walking, biking, or taking public transportation is deemed too cruel and unusual for Americans. sam sklar at Exasperated Infrastructures recently published an article detailing just why it is so difficult to stop super speeders. In short: we aren’t allowed to.

There are various laws that limit punitive measures. If someone doesn’t even hurt someone, just got caught driving in a dangerous manner, there is even more leeway. In one egregious case from Pennsylvania, an off-duty cop hit a family in a crosswalk because he was texting. He faced no real consequences, not even a suspended license, according to local news coverage. Stories like this can be found across the county.
There are arguments that speed governors are dangerous or too inconvenient. The problem with these arguments is that most of us cannot understand speed. “Quite simply, the faster you are going already, the less time you save by going 10mph faster still,” says Rory Sutherland for The Spectator. “Accelerate from 20-30 mph, and you save ten minutes on a ten-mile journey. Accelerate from 70-80 mph, and you save just over a minute.”
The 16% just make things worse with a lack of object permanence, jamming on the gas only to have to slam on the brakes because of cars in front of them. This creates more traffic because they end up bunching up with other cars when weaving in and out of traffic. We are too lenient on this subset of driver. They make everything worse. Yet even when states try to crack down, there are limitations. New York’s news Super Speeder Bill has been hailed as admirable, but it only installs governors for those with 16 tickets in a year. 16! That’s over one per month.
Andy Boenau of Urbanism Speakeasy with Andy Boenau has been critical of the unwillingness to punish these super speeders. He tweeted recently of the new New York law: “Don’t ever forget this story. Leading up to the crash, the killer had:”
“21 speeding tickets in 2 years”
“6 red light camera violations in 6 months”
“70+ other violations in 2 years”
He closed, “She was still free to drive at a murderous speed.” I agree. We must no longer accept the scourge of the 16% on the rest of us. Do we really believe we can stop maniac driving like this by asking nicely? Of course not.
To Stop the 16%, Design Better Streets
Despite the obvious problem, there is not much political will in the country to grapple with super speeders, reckless drivers, or the 16% in general. Democrats tend to lean away from more law enforcement due to equity concerns, while Republicans have become distrustful of more government control, even if traffic enforcement. Changing laws and adding more enforcement is just not always feasible electorally.
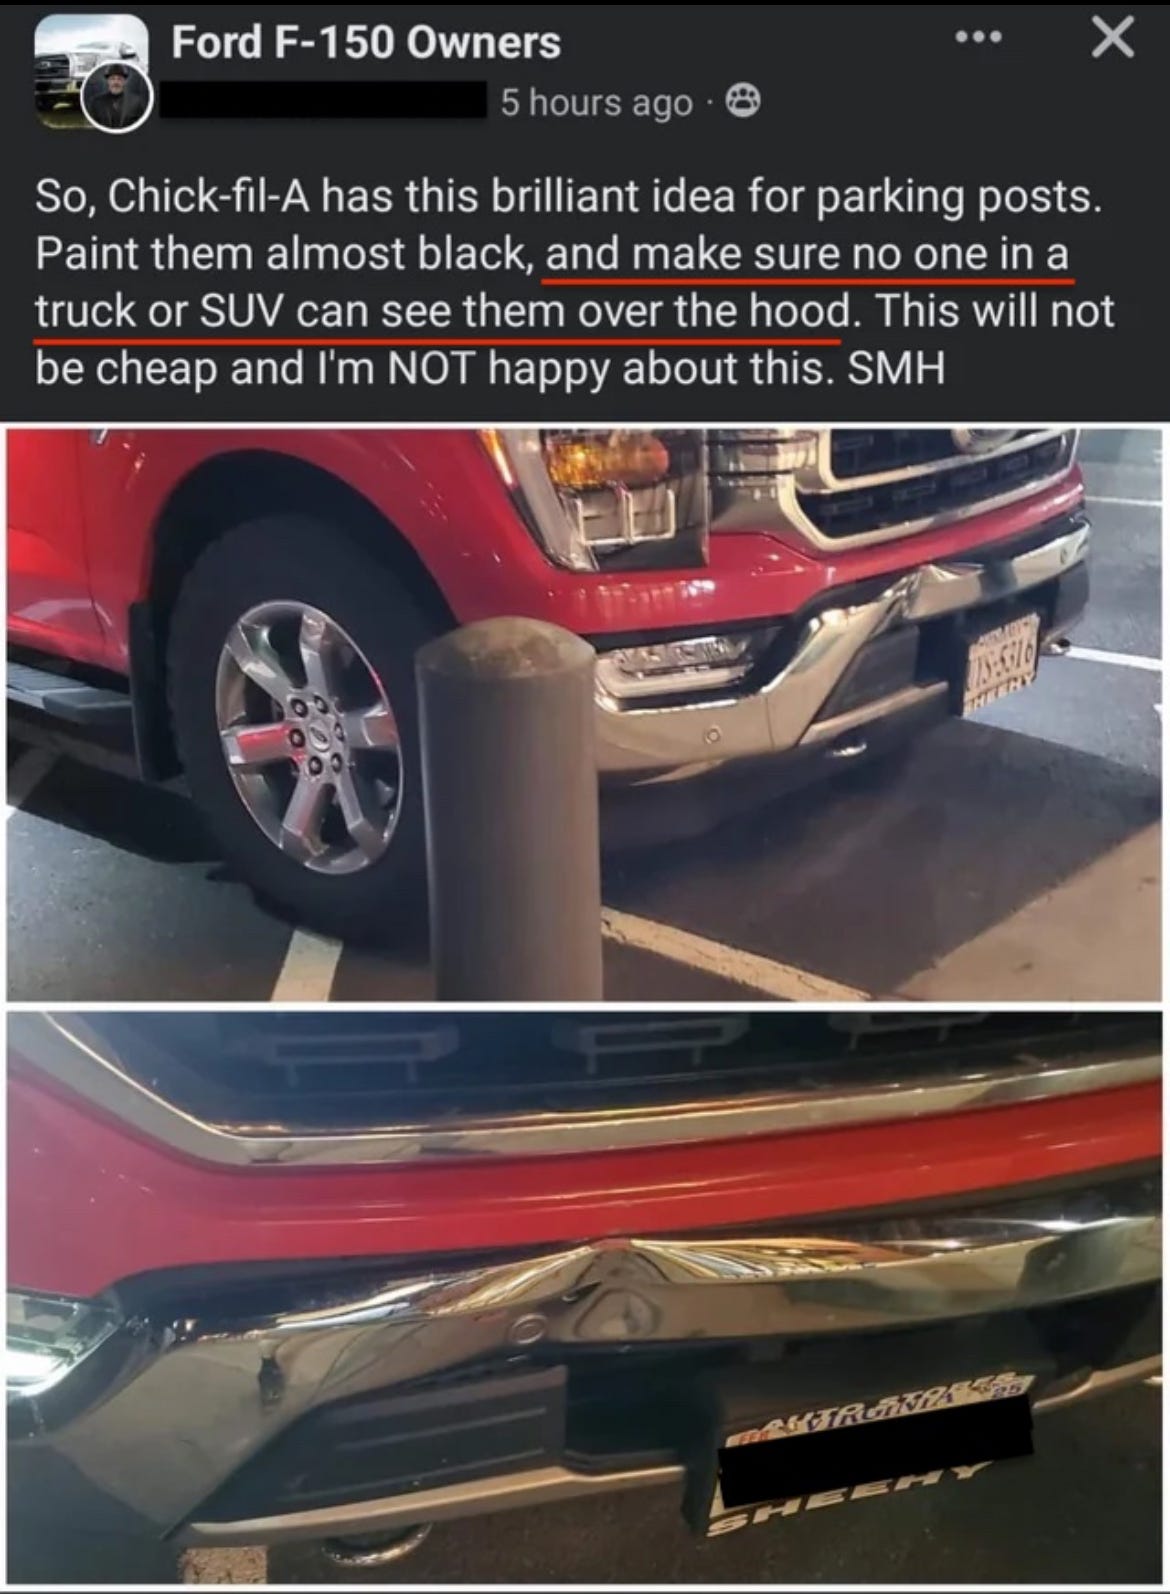
This is where the Strong Towns approach can come in to address the problem. In this conception, street design should dictate the comfort of driving. If we want drivers to slow down, we need to make lanes narrower, add bollards or barriers (real ones, not plastic flexipoles), cover with overhanging trees, and other general traffic-calming measures. I have advocated for these things myself (see my video essay on the topic),
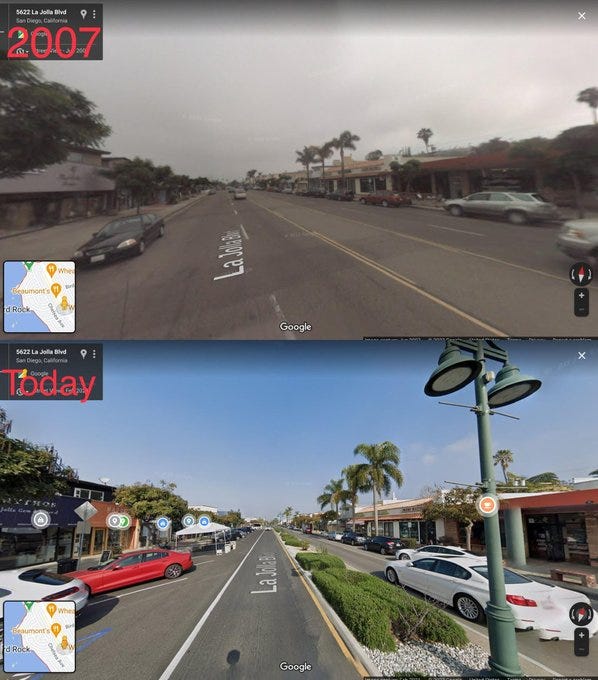
What the Strong Towns approach does is take safety out of the hands of waffling politicians. In a properly designed street, a 16% driver will constantly show themselves by damaging their own vehicle. We want them to hit bollards and scrape concrete walls. This outcome is certainly better than flesh and blood of innocent pedestrians.
My guess is that anyone who gets mad at this 16% concept is in fact in the 16%. They likely cannot stay off their phone, have heated road rage, or just simply struggle with the basics of driving. No matter, getting bad drivers off the road should not elicit hate. It should elicit cheers. And since we cannot always do that, we can help protect the rest of us from the 16% of dangerous drivers through smarter street design.
FWIW if I were dictator, I would focus on just the worst ~2.5% of drivers, and after that would focus efforts on shifting the entire bell curve over, which is to say basically try to shift culture to care about driving more
i really like this piece and i'm proud to have played even a little part in it. lmk if you want to talk more!